
Final project
Individual students will work on a project of their own choice and design over the course of the semester, culminating with a class presentation followed by a final project delivery. The goal of this project is to make a linguistic discovery through application of data-intensive methods.
Components
A project consists of three main components: data, analysis, and presentation.
Data
-
Start with public data. Many linguistics research projects begin with a targeted data collection effort: field work, surveys, elicitation, human subjects, and more. But the underlying assumption of data science is that data already exists—often, though not always, “in the wild”—and it is up to a data scientist to harness it. True to this assumption, we will have you start with data that already exists and is public. (This will also save you a lot of headaches trying to figure out how to share non-public data ethically!)
-
Add value. You should not, however, be content with data as it is packaged and presented to you. In many cases, your data will need a lot of work – sourcing, cleaning up, and reorganizing. In other cases, you may be dealing with published data that’s more or less ready for analysis. You are, then, expected to add value: augmenting, annotating and leveraging multiple data sets are all potential avenues.
-
Follow best data practices. Throughout this semester, we will be learning about best data practices, both emerging and firmly established in data science circles. Make sure your own data efforts and the output are in compliance.
Analysis
-
Linguistic analysis. You will have designed your data with a research question in mind. Your data should make a suitable empirical basis for your linguistic inquiry; your research question should be properly motivated and addressed in a theoretically and methodologically sound manner. Your interpretations of the findings should likewise be rigorously supported by your data. Even with meticulous preparation, however, your data in the end may not prove fruitful grounds for your original research question. Pivoting is therefore allowed up to a certain point; whether or not this move is ultimately successful, reasons for pivoting and/or failure of the original research agenda must be thoroughly probed and documented, since this sort of outcome is all part-and-parcel of research efforts deeply grounded in real-life data and, further, provides valuable insight.
-
Computational methods. In your linguistic analysis, you are expected to employ various computational methods. Proper techniques should be used in accordance with your research question and the specifics of your data. At the same time, you should demonstrate mastery of these techniques by justifying your choice of computational methods and thoroughly evaluating the outcome, rather than blindly applying them and accepting the returned output. As with linguistic analysis, failed experimentation should not be brushed aside, but rather receive proper investigation and documentation, as this is all part of the discovery process. One concrete way this will likely show up is which R package(s) you use; you might need a package that we haven’t discussed, and you might need to try a few before finding the right one.
Since this is an R-based class, your data wrangling and analysis should all happen in R code. Because I don’t use Python, I can’t help you write or troubleshoot Python code. In some cases, it may be advantageous to use an R package that wraps Python code; for example, the Python library text-processing library
spacyis more powerful and contains more features than any comparable package native to R, but fortunately the R packagespacyrprovides an interface tospacy. So while using wrapper packages are permissible, you shouldn’t be interacting with Python code directly. If you’re not sure about what’s okay and not-okay, don’t hesitate to ask!
Never edit data files in Excel, as Excel doesn’t force you to create a reproducible record of what you’ve done to the file.
Presentation
This component encompasses all audience-facing aspects of your project, which include but are not limited to:
- Proper use of GitHub as a project-hosting and publication platform.
- Overall documentation.
- Structure, readability and organization of your R code in the form of Quarto documents rendered to GitHub-flavored Markdown.
- Visualization through plots and/or tables.
- Your oral presentation, scheduled in the last day of class.
- Your final report: language, content, clarity, precision, organization, citation, etc.
Weight distribution. Ideally, a project would have the three components in perfect balance. In reality, everyone’s project will be different: some will have ambitious and challenging data curation plans, while others might wish to focus their efforts on extensive use of advanced computational methods. To accommodate this, a limited amount of trade-off is provisioned between the “data” and the “analysis” components: projects more heavily focused on data are allowed to go easier on analysis-related efforts, and vice versa.
Submission
Your project should be initiated and developed in the form of a GitHub-hosted public repository. The final deliverables should include:
- A README document and a LICENSE document accompanying your GitHub repository
- A written report containing a summary of your data and linguistic analysis
- Roughly 1500 words, of which a minimum of ~1000 words must be devoted to written descriptions (not including charts, graphs, examples, tables, etc.)
- Your data
- R code that you created and used to process, explore, and analyze the data
- Distributed as Quarto documents (both original and rendered to GitHub-flavored Markdown, like our to-dos)
- Slides or other materials you used for your in-class presentation
Project milestones
Over the course of the semester, you will meet several structured milestones:
| Milestone | Due | Task |
|---|---|---|
| Project ideas | Sep 23 | Submit 1-2 project ideas |
| Project plan | Oct 7 | Finalize project plan, create a GitHub project repository |
| Progress report 1 | Oct 28 | Focus on data curation, report progress |
| Progress report 2 | Nov 11 | Continue with data curation, attempt analysis |
| Progress report 3 | Nov 20 | Data-side effort should be done; ramp up analysis |
| Project presentation | Dec 2, Dec 4 | Oral presentation of your work |
| Repository submission | Dec 12 | Turn in final project in the form of a GitHub repository |
Project ideas
Due by 12 noon Sep 23
You should come up with one or two project ideas. Include these details:
- A working title.
- A brief summary.
- The DATA portion. Example points you should address: What will your data look like? What sorts of data sourcing and cleaning up effort will be involved? Do you have a sense of the overall data size you should be aiming for? Do you have an existing data source in mind that you can start with, and if so, what are the URLs or references?
- The ANALYSIS portion. Example points you should address: What is your end goal? What linguistic analysis do you have in mind? Any hypothesis you will be testing? Are you planning to do any predictive analysis (machine learning, classification, etc.), and using what methods?
Since we haven’t discussed all the possible techniques you might want to use, I don’t expect you to necessarily know it off the bat. It’s okay to leave “blanks to be filled-in” like “I’ll perform some sort of web scraping”
Not sure what’s the proper scope for a project? Check out some projects from previous versions of this class. (Note: the 2021 projects weren’t required to use public data.)
Submission
In the project-ideas/ directory of Class-Exercise-Repo, create project_ideas_YOURNAME.md. Commit, push to your fork, and create a pull request for me.
Project plan
Due by 12 noon Oct 7
Launch your project as a GitHub repository and publish a project plan. (If you were choosing between two project ideas, now is the time to pick one!)
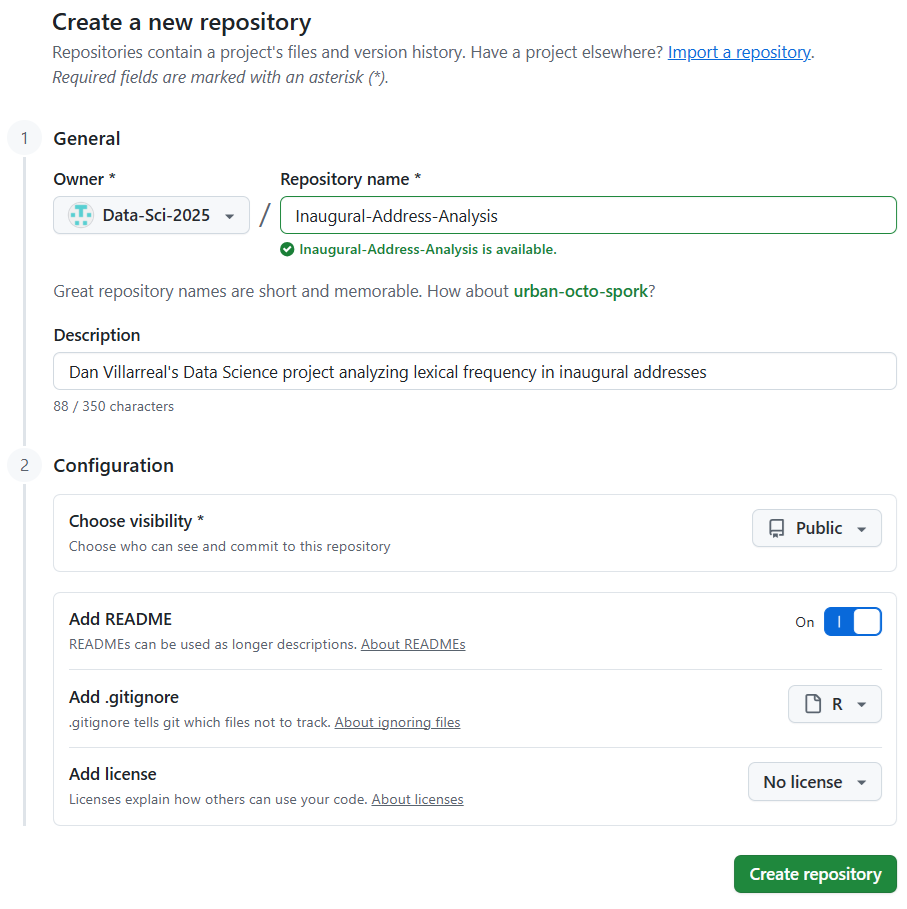
- Create a repository within our GitHub class organization: https://github.com/organizations/Data-Sci-2025/repositories/new. See this screenshot
- The repo owner will technically be
Data-Sci-2025(the GH org) - Give it a descriptive name that is not too long. Good choice: “Inaugural-Address-Analysis”, bad: “Dan-Final-Project”.
- Provide a description. This is a short tagline that appears under your repo title. Start with something simple. Make sure your name is in there. (See the screenshot above.)
- The repository should be public.
- Initialize with a README, but don’t choose a license yet.
- Add GitHub’s .gitignore template for R. Once you initialize your repo, add onto it; I strongly recommend using the .gitignore template for your operating system.
- The repo owner will technically be
- This is YOUR repo! No forking necessary: just clone it onto your local machine and get to work.
- Your repo should have the following files:
README.md: Include your name, project title, and a brief summary here. We’ll keep this page minimal for now.LICENSE.md: You will eventually need to specify a license for your project. Build it now as a place holder.project_plan.md: This is your project plan- Start with your project ideas document, add more concrete details, and polish it up. What is the end goal of your project? How will you get there?
- If you floated multiple ideas in your project ideas document, choose one
- Try to account for possible unknowns and contingencies (e.g., finding the right R package for your analysis method), which may affect the scope of the finished product
- If there are citations relevant to the data and/or analysis portions, mention them here. These needn’t be formal bibliographic citations, they can just be a link to the dataset, package, or article. No need to do a full lit review for the linguistic/theoretical background, and it’s okay if you haven’t nailed down all the details yet (e.g., which package you’re using); this is more so I can get a sense of how you might implement your project
progress_report.md: This is where you will log your progress. Add your first entry..gitignore: You should have a .gitignore file for R, plus any other paths you want to ignore. You can find other .gitignore templates here; I strongly recommend using the .gitignore template for your operating system.
- Of course, this won’t be everything you’ll eventually add to your repo!
- You are welcome to put other directories and files in your local repo as you see fit, but do not commit them to Git yet. Once anything is on Git and GitHub, it’s always there (i.e., recoverable) as part of the commit history.
- Likewise, don’t commit your data files yet. You are likely unsure at this stage whether or not you have the rights to share the data freely.
- A suggestion: create a directory called
private/where you will keep any private notes and data files. Add this directory to your.gitignorefile. - Having said that, don’t be afraid to publish changes to your GitHub repo on an ongoing basis. I have access to your repo’s state at any given point in time, so there is no need to keep your repo pristine & frozen leading up to a milestone.
Submission
Your project repo counts as your submission.
Progress report 1
Due by 12 noon Oct 28
For this progress report, focus on your data. Goals:
- Mostly complete the data acquisition process.
- Start and make headway into cleaning and reorganizing your data.
- By now, you should have concrete ideas on the “data endgame”: what your data’s final form will be, the target total size, format, etc.
Contents:
progress_report.md- Create a section called “Progress report 1” in which you provide a summary of what you’ve accomplished so far.
- Keep it short (1-2 screen-fulls), and provide relative links (including section links) to related documents, including your Markdown file(s) and data samples.
- Focus primarily on how you’ve gained ground so far, and less space to things you’ve tried that didn’t pan out
- Include a “next steps” subsection
- At least one Quarto document, rendered to GitHub-flavored Markdown, with an overview of your data and your current data-processing pipeline:
- Provide an overview of your data, including some basic stats on your data: the size (as of now) and the makeup are the bare minimum.
- Document the steps of your data pipeline (both in prose and code), including any decisions you’ve had to make and how you reached that decision
- Most likely you will not be on the final version of your data pipeline. This is okay! If you’ve only tested your data pipeline on a subset of your data, make sure to mention that explicitly.
- Remember: your Markdown file(s) are how you’re communicating your project to people who aren’t in your head. Make it easy for me and your classmates to understand what you are doing. Explain your goals, show your data and your processes.
- This can be a single document, or multiple documents, depending on what works for you. Name your document(s) in some way that is easy for other viewers to follow, and use relative links to help direct readers’ attention.
- Some form of your data
- If you are unable to share the raw data, then share whatever derived data (e.g., measurements) you can.
- Make sure the data pipeline in your Quarto document(s) makes it clear how the derived data was extracted from the raw data.
- An easy way to do this is to have the raw data in a
.gitignore-d directory within your repo so you can use relative paths to read the raw data
- Again, your data pipeline is probably not complete yet (in terms of end-to-end coverage, or in terms of working for all of your data), so just be clear about where you are in the process.
- If you are unable to share the raw data, then share whatever derived data (e.g., measurements) you can.
Above are the minimum requirements, but do feel free to impose additional organization as you see fit. This is your project, after all! Down the line, you’ll be using your README.md as a landing page for your project, where you can direct readers to the appropriate folders and files. You can start on that now if you want to, but it’s not required.
Submission
Your project repo counts as your submission. Remember that you can push commits to your repo at any time (and in fact it’s best to make incremental commits rather than doing everything at once), but whatever is in there by the deadline is what I’ll review for this progress-report assignment.
Progress report 2
Due by 12 noon Nov 11
For this progress report, ease up your focus on data and start working on analysis. Goals:
- Complete your the data acquisition process.
- Be mostly done with cleaning and reorganizing your data. It should be more or less in its final form.
- The overall format, shape and size of your data should be known at this point. Document them.
- Finalize the sharing scheme of the “found” portion of your data, and get your overall data into a sharable form.
- Finalize the license for your data and project.
- Start bringing in the analysis part into your project. In particular, your manipulation of data should be shaped by the linguistic analysis you are after.
As for the progress report itself, it should include:
- Your progress report:
progress_report.md- Create a section entitled “Progress report 2”, and then provide a summary of what you accomplished. Again keep it short (1-2 screen-fulls), and provide links to related documents, including your Quarto document and other folders/documents.
- Include two subsections:
- Sharing scheme for the “found” portion of your data. You had already made some tentative plans as part of the previous progress report; you are finalizing the scheme here.
- Your decision on licensing for your project and reasons/justification (see below).
- Your code in the form of an Quarto document, rendered to GitHub-flavored Markdown. You have three options:
- Existing: the existing Quarto document which was part of your Progress report 1. You continue to update and add to it.
- New replacement: a whole new Quarto document that replaces the earlier one. The Quarto document you submitted earlier as part of Progress report 1 is now regarded as initial exploration and is no longer part of your work pipeline.
- New continuing: a new Quarto document that’s part of a pipeline. The earlier Quarto document you submitted for Progress report 1 accomplishes PART 1 of your work pipeline, and this new file is PART 2 that picks up where PART 1 left off.
- On top of your Quarto document, specify which type it is so we will have a sense of how the Quarto document fits in your project. Make a note of this in your “Progress report 2” section as well.
- Your data: include it in a designated folder. Suggested name:
data/. Be careful not to commit anything that you cannot publish.- If including the found portion of your data in its entirety, make sure it’s within your right to do so. Present a justification in your “Progress report 2” section.
- If you are including samples, make sure it’s within your rights to do so. Document your sampling method and justification in “Progress report 2”.
- Are you including derived data? Again, provide justification.
- Are you including some new data you created yourself, like annotation? Again, document it.
- Your license:
LICENSE.md.- This is a binding licensing document, intended as audience-facing. This is where you lay out your licensing terms for your future visitors wanting to use your data and code.
- Do not confuse this with the license of the dataset you downloaded: this document is about you specifying a license for your project repo.
- You may adopt popular, existing licensing standards: see this guide.
- Include reasons/justifications in the appropriate subsection in your progress report.
Submission
Your project repo counts as your submission.
Progress report 3
Due by 12 noon Nov 20
For this progress report, you should focus on analysis. Goals:
- Wrap up your data-side effort: your data is in its final form with clear documentation.
- The license for your data and project is all ready, and your data is in its ready-to-share form.
- Make substantial headway into the analysis part of your project. You should have some preliminary findings that are either sufficiently close to what you set out to investigate, or at least meaningful enough in their own right and point to immediate next steps.
As for the progress report itself, these should be the content:
- Your progress report:
progress_report.md- Create a section entitled “Progress report 3”, and then provide a summary of what you accomplished. Again keep it short (1-2 screen-fulls), and provide links to related documents, including your Quarto document and other folders/documents.
- Your code in the form of Quarto, rendered to GitHub-flavored Markdown. The same three options:
- Existing: the existing Quarto document which was part of your Progress report 2. You continue to update and add to it.
- New replacement: a whole new Quarto document that replaces the earlier one. The Quarto document you submitted earlier as part of Progress report 2 is now regarded as initial exploration and is no longer part of your work pipeline.
- New continuing: a new Quarto document that’s part of a pipeline. The earlier Quarto document you submitted for Progress report 2 accomplishes PART 1 of your work pipeline, and this new file is PART 2 that picks up where PART 1 left off.
- On top of your Quarto document, specify which type it is so we will have a sense of how the Quarto document fits in your project. Make a note of this in your “Progress report 3” section as well.
- Your data:
- Some of you have worked on your data files. Make sure to note it in the “Progress report 3” section.
- Are your data files finished as of Progress report 2? No new changes since? If so, make a note of it in “Progress report 3”.
README.mdfile:- If you haven’t already, make sure your project has a proper title (not just your repo name like
Inaugural-Address-Analysisbut something human readable)
- If you haven’t already, make sure your project has a proper title (not just your repo name like
Submission
Your project repo counts as your submission.
Project presentation
Presenter schedule (randomly generated)
- Dec 2: Ashley, Zihan
- Dec 4: Nicole, Sarah
Format
- Your slot is precisely 25 minutes long: 20 minutes for the presentation portion plus 5 minutes provisioned for questions.
- Prepare PowerPoint, PDF, or any other visual aids. You may go over some of your GitHub repo contents, but if you choose to do so it should be clear you are following pre-meditated plans, not just ad-libbing.
- Rehearse and time your presentation!
- If you use slides, make sure they’re numbered so we can refer to them in the Q&A
- Commit and push your presentation visual aids (saved in PDF format) to your repo before your presentation
Content
- Your project, of course! But unlike your project itself that dives right into data, you should start with motivating and contextualizing your project topic. That means supplying background information, research questions, theoretical foundations and related literature, and so on.
- That said, keep your literature to one slide (or the equivalent), tops. Many grads fall into the trap of spending too much time showing how much they’ve read, and not enough time discussing their actual project
- Be sure to show your data and findings through visualization.
- When you render a Quarto document that creates plots and uses
format: gfm, it automatically creates a subfolder with figures as individual files, which you can easily drop into your slides. Specify a nice name for this folder since that’ll be part of your final submission.
- When you render a Quarto document that creates plots and uses
- Make sure your analysis is the central focus.
Evaluation
- Your presentation will be evaluated based on the following: accuracy and depth of content, originality, presentation, engagement with audience, and delivery.
- If you are presenting on Tuesday, I will take into consideration that your analysis part may be slightly less developed.
Repository submission
Due by 6pm Dec 12 (end of Fall exam period)
You’ve worked hard through many project milestones, and it’s time to prepare your project for final submission. Unlike the three progress reports where the focus was firmly on the process, the final submission should highlight the results and your interpretation of them. The process should still get a fair and clear illustration, but you should prune out from your production code any “branches” representing trial-and-error that led to a dead end. (You are encouraged to move any old code bits into a designated “scratchpads” subfolder.) All in all, your GitHub repo should present a coherent picture of your project, from start to finish—someone looking at it from the outside should perceive a product, not a work-in-progress.
Your repo: files and folders
Below are the required files with predetermined file names. Objects that are entirely/substantially new in this submission are in orange, with more details linked below.
README.mdfinal_report.mdLICENSE.mdproject_plan.mdprogress_report.md
In addition, you should have:
- A designated folder for your data, and data files inside (where applicable)
- A designated folder for figures, graphs and other image files
- Quarto documents, both the original
.qmds and the rendered.mds - Your presentation visual aids, saved in PDF format
Lastly, some of you might have extra files and directories serving some purpose: perhaps a “scratchpads” folder containing some old code that is no longer relevant, or something like that. Make sure to explain what these are in your README.md document.
README.md
Revamp your README document and give it a proper structure. This document is what greets your visitors, so its goal should be to give them a short but proper orientation. Remember that these visitors may include you-in-six-months; think about what you’ll need to know once you forget all the little details. It should include:
- Front matter: the title of your project, your name, email, date
- A brief description of your project
- A brief description of the data set you started your project with. Include a web link (if any) along with proper attribution.
- For most projects, the raw data will be downloaded by your
.qmdcode and/or loaded from a file you’ve included in the repo. However, if some or all of your raw data needs to be acquired some other way (e.g., it’s a licensed dataset like CELEX or ICE), explain how to get it (and also mention this very early in your qmd file(s))
- For most projects, the raw data will be downloaded by your
- A bullet-point list of the files and folders along with a one-line description of what they are.
- Make them into clickable relative links so your visitors can easily navigate to the files/folders.
- Put your
final_report.mdon top, and bold it so it stands out. - For your Quarto documents, link to both the original
.qmdand the rendered.md - Do not list all the image files in your subfolders. If you have a bunch of individual data files, don’t list all of them, either (though do list processed data files, if applicable)
final_report.md
Think of this as a usual class paper. Details:
- Shoot for around 1500 words (not including references, if you have any). That’s the length of a short paper of about 5 pages.
- Use headers and clearly mark your sections.
- Use visualization! Display figures you had saved as external image files.
- Your report should describe only the high-level details of your code implementation, much like you’d see in a published paper.
- Use relative heading links to point readers to relevant sections of your rendered
.mdfile(s). This is especially useful if you find yourself devoting too much space to implementation in the final report itself
- Use relative heading links to point readers to relevant sections of your rendered
- What should you include in this report? Revisit the overall description of the project at the top of this page.
- Have one paragraph at the end of your report devoted to the overall history and process of your project, warts and all. Document setbacks, false starts, and other difficulties you experienced.
- This material should be contained to a single paragraph, and it shouldn’t set the tone for the whole report. Remember: research is always a work-in-progress. There’s a fine line between acknowledging challenges on the one hand, and undermining credibility in the eyes of readers on the other hand
Images folder and files
Your final_report.md file will need figures and graphs for illustration.
- Have a folder, named
imagesor something, where all image files should go.- When you render a Quarto document that creates plots and uses
format: gfm, it automatically creates a subfolder with figures as individual files, which you can easily drop into your slides. By default, this folder is named something like<doc-title>_files/figure-commonmark. You can override this default using thefig.pathknitroption as a global option in your YAML header:knitr: opts_chunk: fig.path: "images/" - You can then plunk these image files into your
final_report.md, where they serve as figures.
- When you render a Quarto document that creates plots and uses
- Under no circumstances are you allowed to use screenshots of RStudio outputs!
- If you’re not sure how to save some image from your Quarto documents to plunk into your
final_report.md, please ask
- If you’re not sure how to save some image from your Quarto documents to plunk into your
Your code: Quarto
The same usual guidelines for your Quarto documents continue to apply: your code should work correctly while walking the audience through the whole process. This time around, however, your code should be in a streamlined form: you should prune your code of any unsuccessful bits and experiments that have since been abandoned. In other words, your code documents should demonstrate your project in a lean and coherent manner. Some important points:
- Think about you-in-six-months. What will you need to know once you forget all the little details?
- As mentioned above, if readers need to acquire the raw data elsewhere, mention this very early in your Quarto document (or your first one, if there’s multiple)
- For many of you, breaking down your code into multiple Quarto documents will make organizational sense. For example, the first file could focus on data clean-up effort (saving the result as a
.csvor.Rds), and the second one takes from there and conducts data analysis, and so forth. - Pay attention to your outputs:
- Make sure they’re meaningful (they’re in a format that’s useful for understanding what’s going on, they show the appropriate columns, etc.)
- Avoid “splashing the console” (printing super-long outputs). If you want to print more than 10 lines of a tibble, pipe it into
print(n=<however many rows you want to print>)
- Your code may produce interim outputs (e.g., your data-cleaned
.csv). If you decide against sharing them, make sure to exclude them from GitHub repo via.gitignore. - Inspect your rendered
.mdfile(s) to ensure that they’re formatted correctly—do outputs make sense, do links work as expected, do figures show up? etc.